
Create engaging charts in minutes with Sylagon.
The visualization platform for enthusiasts who tell stories with numbers and facts.
Try for free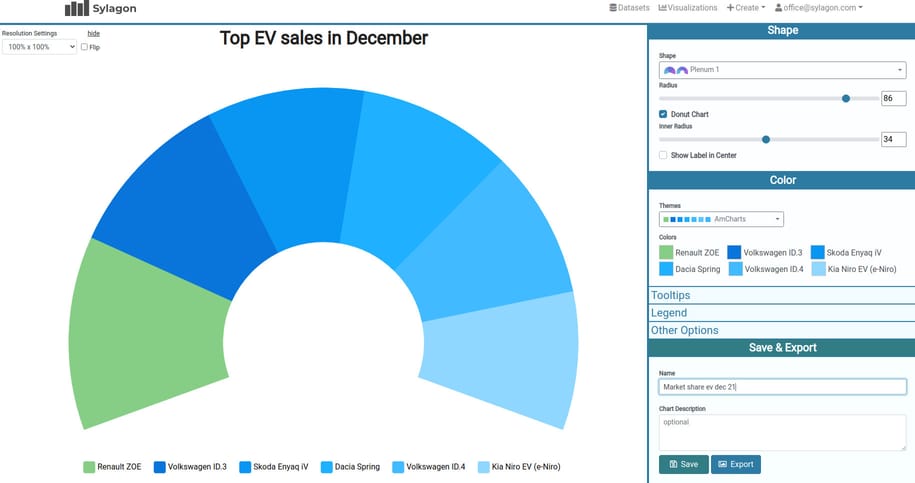
Allow readers to explore the stories you are telling through interactive visualizations and increase the time they spend reading your articles.
Embed our hosted visualizations as small code snippets in your online articles or download them as vector graphics which are ready for printing.
Define how visualizations should look for both online and print by setting fonts, sizes and colors to match the look and feel of your custom design.
Browse through some examples created with Sylagon.
No account required. Just start creating charts with our example datasets.
Try for freeSylagon is a platform for creating data visualizations in form of simple charts.
It works by uploading a CSV file or filling out a table of values. Sylagon then analyzes the input and gives you a set of visualization options which make the most sense for the given data.
You can choose between these visualization options and do further customizations. When you are happy with the final result, you can export the visualization as an embeddable code snippet for your website, or you can download a print-friendly vector graphic for your document.
Try Sylagon for free, there is no payment information required. You can create as many datasets and visualizations as you like.
However, we will regularly delete datasets and visualizations of unregistered users. After registration no deletions will occur.
This is the first release of Sylagon. You can create basic charts with standard customization options. We are working on more advanced visualization types and additional customization options.
No, Sylagon focuses on a clean user interface with a fast and simple process for creating visualizations. It runs various analysis and detection steps in the background, and comes up with meaningful visualization options to assist you in the creation process.